
Break away from what you see everyday and make exciting business charts built on simple ideas. Making charts interesting in presentation slides can sometimes be challenging. We often end up with boring and complex charts generated by PowerPoint. Trying to change selected parts of the generated chart seems to be difficult.
Here are 10 design ideas for making simple and exciting charts for your business presentations. This manual approach using shapes in PowerPoint or Keynote helps us build simple and exciting business charts. Using the manual approach allows us to have control over how we want the chart to look.
Take a look at the 10 chart ideas below. It will get you started thinking of new ideas for your business charts.


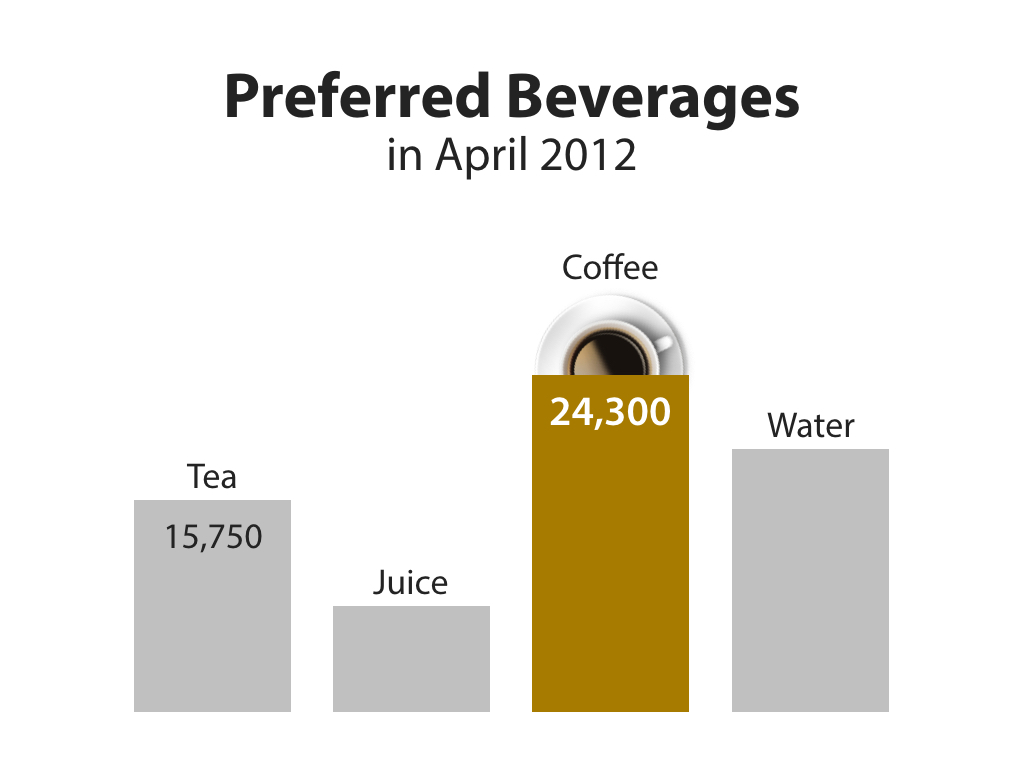

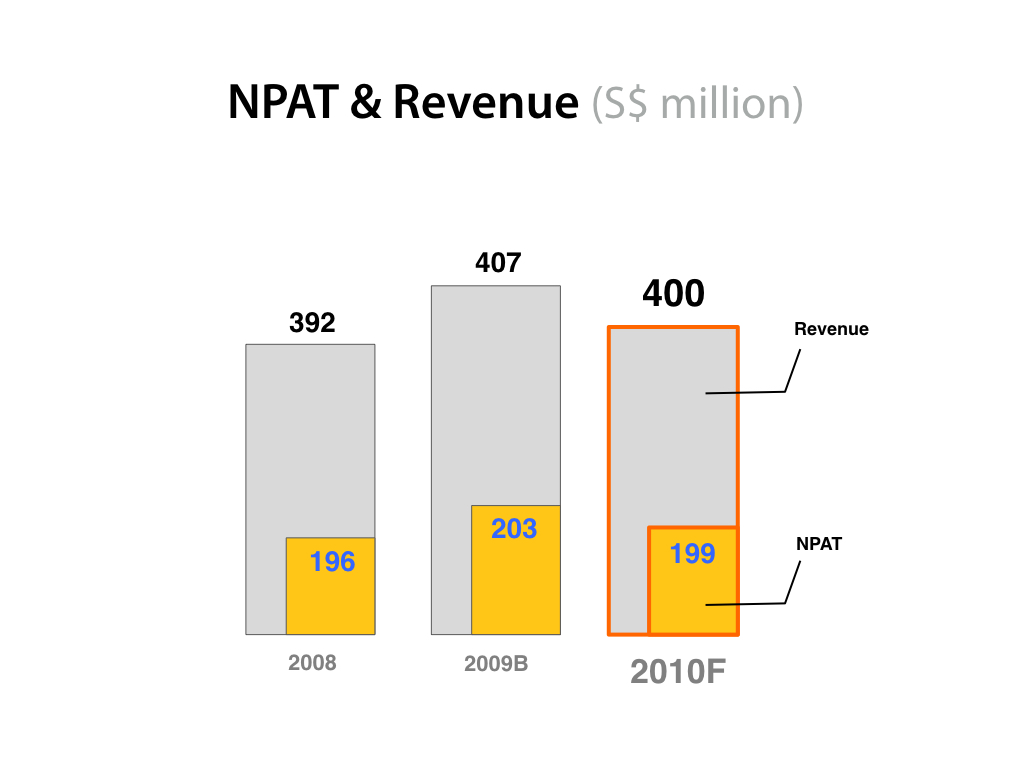
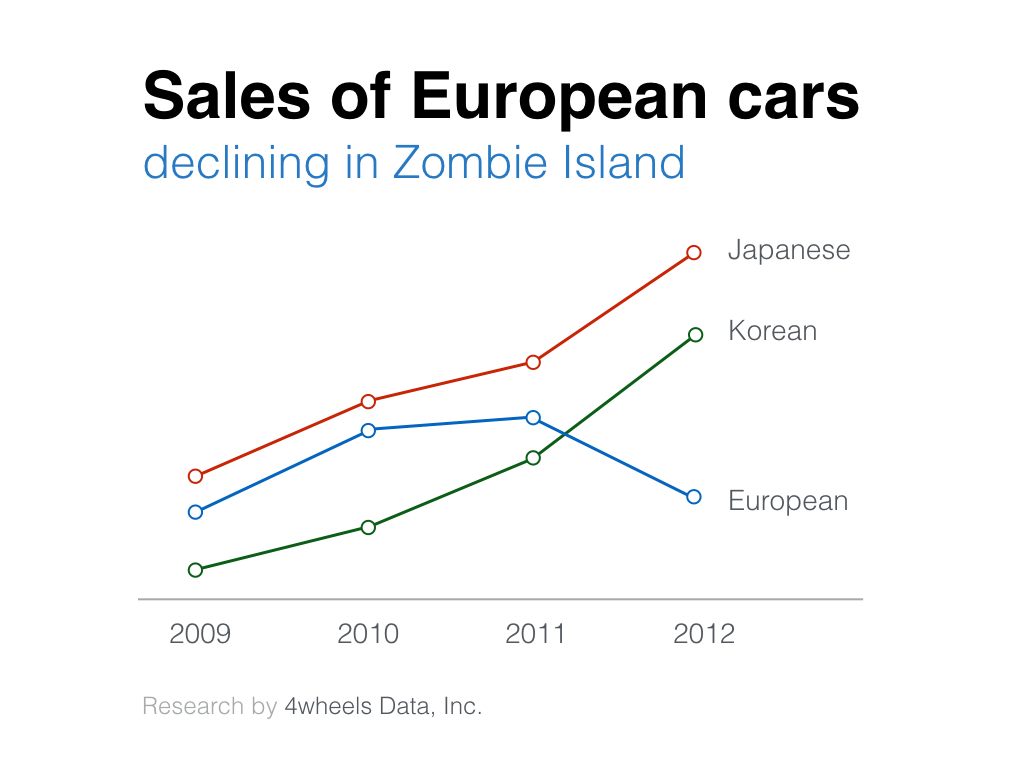

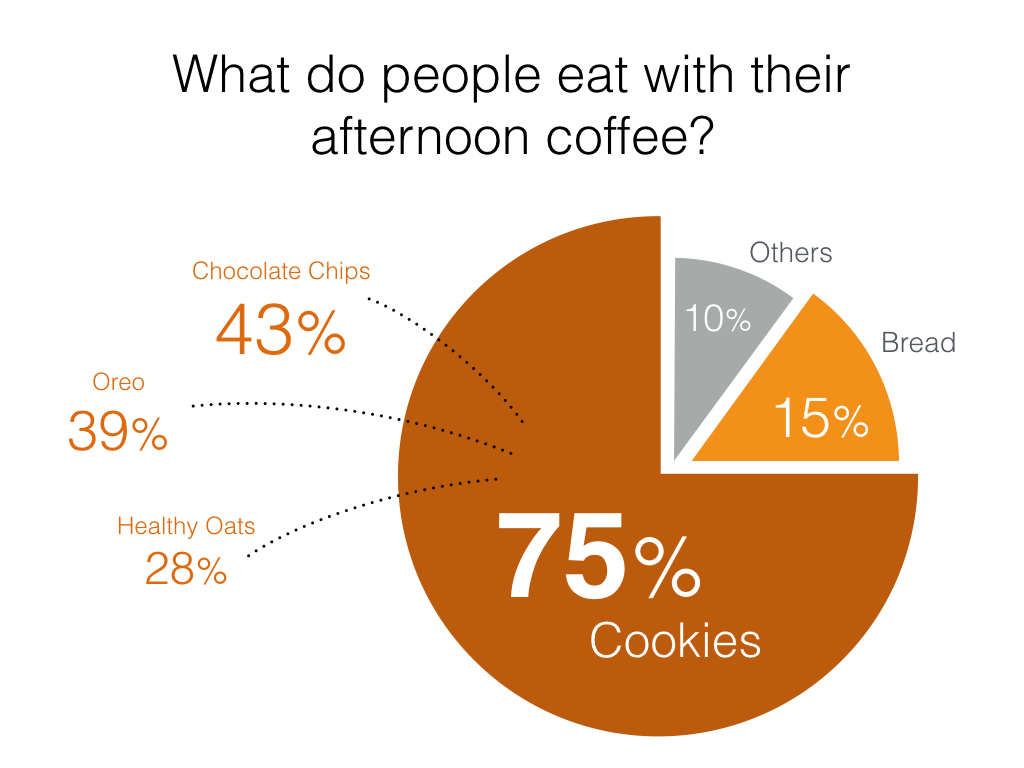


Stop using the standard and boring charts that you see everyday and start creating simple and exciting charts for your business presentations.
Download the PDF of this story for your own reference and share it with friends and colleagues.
Want more chart ideas for your business presentations?
Check out my book "Spinning I.D.E.A.S.", available in book stores in Singapore and Thailand (Thai language version).


